Neuroimmunology
Quality-of-life scales for neurologic diseases
Jun. 13, 2025
MedLink, LLC
3525 Del Mar Heights Rd, Ste 304
San Diego, CA 92130-2122
Toll Free (U.S. + Canada): 800-452-2400
US Number: +1-619-640-4660
Support: service@medlink.com
Editor: editor@medlink.com
ISSN: 2831-9125
Toll Free (U.S. + Canada): 800-452-2400
US Number: +1-619-640-4660
Support: service@medlink.com
Editor: editor@medlink.com
ISSN: 2831-9125
Nearly 3,000 illustrations, including video clips of neurologic disorders.
Every article is reviewed by our esteemed Editorial Board for accuracy and currency.
Full spectrum of neurology in 1,200 comprehensive articles.
Listen to MedLink on the go with Audio versions of each article.
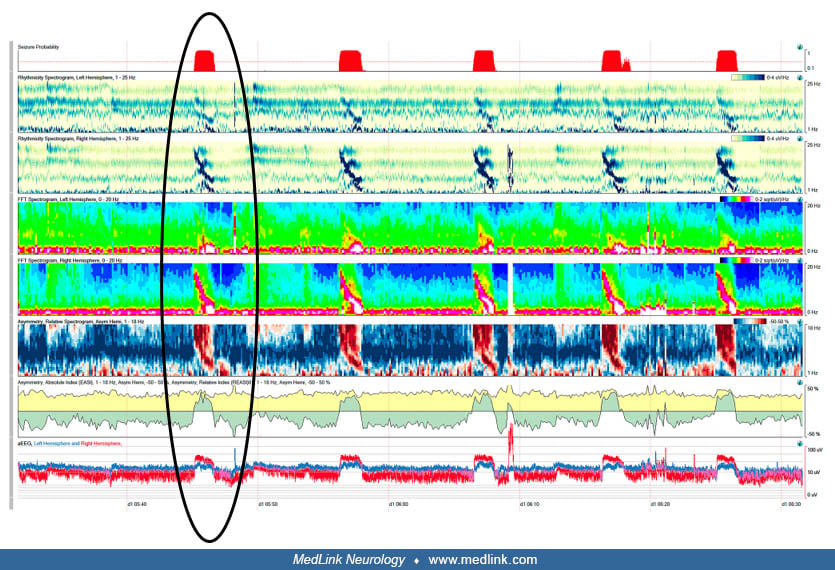
Quantitative EEG in a 60 year old with mental status changes due to serial seizures. Right hemispheric seizure (oval) present on the seizure probability trend (1st row) appears as a red block. This corresponds to the “footprint” seen in the rhythmicity spectrogram (rows 2 and 3). Note the greater power in row 5 (right hemisphere) on the FFT spectrogram concordant with the relative asymmetry spectrogram (red= right), asymmetry absolute index (upward deflection= right), and amplitude integrated EEG. The recording duration is 1 hour, and the seizures recur every 10 minutes. (Reproduced with permission from Demos Medical Publishing, LLC. Adult EEG: An interactive Reading Session. Brenner RP, Scheuer ML. 2nd ed. 2014.)