Epilepsy & Seizures
Epilepsy surgery in adults
Nov. 04, 2008
MedLink®, LLC
3525 Del Mar Heights Rd, Ste 304
San Diego, CA 92130-2122
Toll Free (U.S. + Canada): 800-452-2400
US Number: +1-619-640-4660
Support: service@medlink.com
Editor: editor@medlink.com
ISSN: 2831-9125
Toll Free (U.S. + Canada): 800-452-2400
US Number: +1-619-640-4660
Support: service@medlink.com
Editor: editor@medlink.com
ISSN: 2831-9125
Nearly 3,000 illustrations, including video clips of neurologic disorders.
Every article is reviewed by our esteemed Editorial Board for accuracy and currency.
Full spectrum of neurology in 1,200 comprehensive articles.
Listen to MedLink on the go with Audio versions of each article.
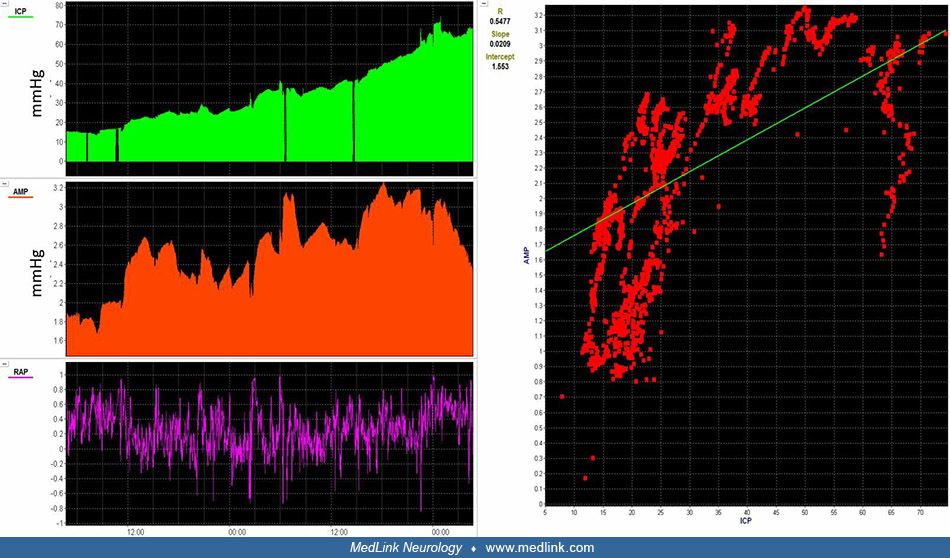
A 4-year-old female underwent multimodality neurologic monitoring with intraparenchymal intracranial pressure monitoring. The pressure reactivity index was used to evaluate cerebrovascular pressure reactivity efficiency. When plotting the pressure reactivity index over cerebral perfusion pressure in an epoch of 8 hours, there is a parabolic curve, suggesting that the optimal cerebral perfusion pressure for cerebrovascular pressure reactivity efficiency (CPPOpt) is approximately 64.8 mmHg, with an estimated lower limit of cerebrovascular pressure reactivity (LL) at approximately 48.9 mmHg and an upper limit of cerebrovascular pressure reactivity (UL) at approximately 80.8 mmHg. In the fourth row from the top, the green band represents the theoretical range of LL and UL, the red line represents real-time calculated CPPOpt, and the yellow line represents the patient’s actual cerebral perfusion pressure values. (Contributed by Dr. Brian Appavu.)