Neuro-Oncology
Pleomorphic xanthoastrocytoma
Sep. 29, 2025
MedLink, LLC
3525 Del Mar Heights Rd, Ste 304
San Diego, CA 92130-2122
Toll Free (U.S. + Canada): 800-452-2400
US Number: +1-619-640-4660
Support: service@medlink.com
Editor: editor@medlink.com
ISSN: 2831-9125
Toll Free (U.S. + Canada): 800-452-2400
US Number: +1-619-640-4660
Support: service@medlink.com
Editor: editor@medlink.com
ISSN: 2831-9125
Nearly 3,000 illustrations, including video clips of neurologic disorders.
Every article is reviewed by our esteemed Editorial Board for accuracy and currency.
Full spectrum of neurology in 1,200 comprehensive articles.
Listen to MedLink on the go with Audio versions of each article.
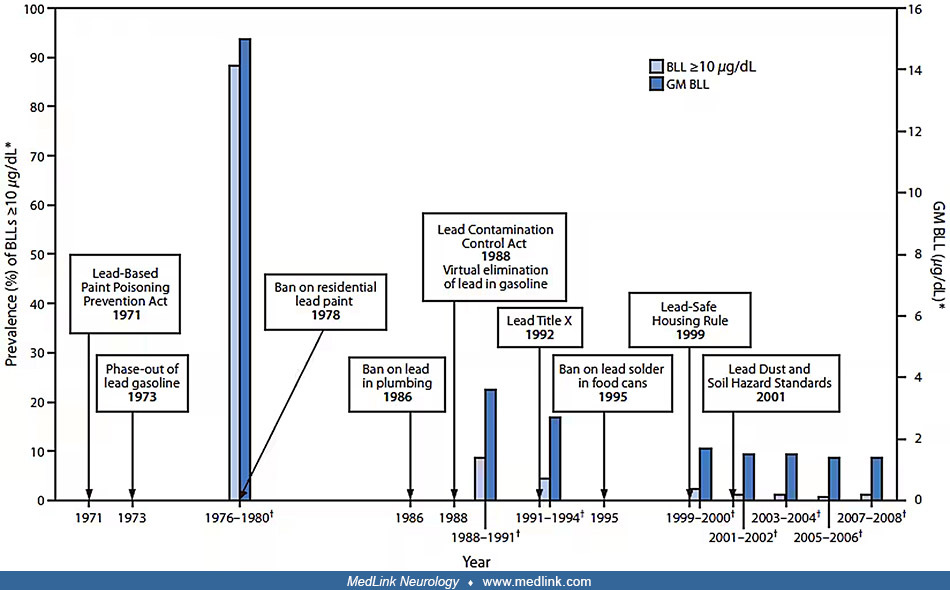
Timeline of lead poisoning prevention policies and blood lead levels in children aged 1 to 5 years, by year -- National Health and Nutrition Examination Survey, United States, 1971-2008. Abbreviations: BLL = blood lead level; GM = geometric mean; NHANES = National Health and Nutrition Examination Survey. The bars in the chart for BLL and GM represent estimated values at different NHANES survey periods. National estimates for GM BLLs and prevalence of BLLs 10 µg/dL or higher, by NHANES survey period and sample size of children aged 1 to 5 years: 1976-1980: N = 2,372; 1988–1991: N = 2,232; 1991-1994: N = 2,392; 1999-2000: N = 723; 2001-2002: N = 898; 2003-2004: N = 911; 2005-2006: N = 968; 2007-2008: N = 817. (From: Brown MJ, Margolis S. Lead in drinking water and human blood levels in the United States. MMWR Surveill Summ 2012;61 Suppl:1-9. Public domain.)