


Neuro-Oncology
Vestibular schwannoma
May. 27, 2026
MedLink, LLC
3525 Del Mar Heights Rd, Ste 304
San Diego, CA 92130-2122
Toll Free (U.S. + Canada): 800-452-2400
US Number: +1-619-640-4660
Support: service@medlink.com
Editor: editor@medlink.com
ISSN: 2831-9125
Toll Free (U.S. + Canada): 800-452-2400
US Number: +1-619-640-4660
Support: service@medlink.com
Editor: editor@medlink.com
ISSN: 2831-9125
Worddefinition
At vero eos et accusamus et iusto odio dignissimos ducimus qui blanditiis praesentium voluptatum deleniti atque corrupti quos dolores et quas.
Evaluation and diagnosis in neuro-ophthalmology involves regular use of optical coherence tomography, B-scan and A-scan ultrasonography, retinal fluorescein angiography, and autofluorescence fundus photography.
|
• Optical coherence tomography is a noninvasive ophthalmic imaging modality that generates high-resolution images of the retina, including the optic nerve head, that can be applied to observe optic nerve head swelling and detect retinal causes of vision loss. | |
|
• Quantitative measurements of layers containing the ganglion cells that form the optic nerve can be applied to measure neurodegeneration and detect optic atrophy. |
This noninvasive imaging technique is like ultrasound but uses light waves instead of sound waves. Using information contained in the light waves reflected from different depths, OCT reconstructs a depth profile of the structure being analyzed. Relevant to neurology is the analysis of retinal layers in different regions of the eye (eg, macula, optic nerve), which can be interpreted using qualitative and quantitative approaches. Resolution is on the order of 5 to 10 μm.
Most ophthalmic OCT devices are tabletop devices with a chin and forehead rest that position the seated patient’s eye in front of a camera. Ophthalmic OCT devices generate 2D and 3D representations of the retina differing by region (eg, optic nerve, macula) and scan protocol (eg, cross-sectional B-scan, volume scan, circle scan). For example, an optic nerve head volume scan can be used to construct a topographical map of the optic nerve head from which optic nerve diameter and cup-to-disc ratio can be calculated. A typical scan protocol takes only a few seconds per eye.
The three main categories of OCT instrumentation are time-domain OCT (TD-OCT), spectral-domain OCT (SD-OCT), and swept-source OCT (SS-OCT). SD-OCT is much faster and has markedly better resolution than TD-OCT and now dominates the market (14). SS-OCT provides rapid, high-resolution cross-sectional and volumetric measurement of choroidal structure, imaging deeper into the retinal pigment epithelium. Higher resolution scanning allows measurement of individual layers of the retina to monitor axon loss. Various manufacturers of OCT instruments differ in their imaging protocols and quantitative analyses. Measurements cannot be directly compared between instruments.
Enhanced depth imaging (EDI-OCT) is performed with some SD-OCT instruments. This permits deeper measurements of the optic nerve head down to the lamina cribrosa and is helpful for visualization of pathologies such as optic disc drusen and choroidal changes. Swept-source OCT can also be utilized for deeper imaging.
Vision disorders. Optical coherence tomography is useful for evaluating patients with visual deficits, papilledema, and other causes of optic disc swelling, nerve fiber layer thinning owing to retinal ganglion cell damage, macular degeneration, central serous chorioretinopathy, and other retinal causes of vision loss.
Most OCT systems have built-in analytics that can differentiate between alterations in various retinal layers. The “macula scans” provide quantitative measures of total and segmental retinal thickness in the retina surrounding the fovea. The “optic nerve scans” provide a measure of retinal nerve fiber layer thickness where the ganglion cell axons come together to form the optic nerve. Thinning of the retinal ganglion cell (nerve fiber) layer is the most useful measure in optic nerve disorders because it detects loss of axons that enter the optic nerve
Retinal ganglion cell layer thinning may arise from lesions involving the optic nerve, chiasm, or tracts. Such thinning may be present even when optic disc pallor is not evident. Any optic neuropathy, including glaucoma, can lead to decreased ganglion cell layer thickness, so a comprehensive eye and neurologic evaluation are crucial for correct diagnosis.
OCT-measured thinning of the macular ganglion cell layer has been found to have a strong relationship with visual loss across a spectrum of optic neuropathies, including glaucoma, optic neuritis, ischemic optic neuropathy, hereditary optic neuropathy, toxic optic neuropathy, optic nerve glioma, and idiopathic intracranial hypertension.
Thickening of the peripapillary ganglion cell layers around the optic nerve (peripapillary retinal nerve fiber layer) can occur in optic nerve head edema due to swelling of the ganglion cell axons, a feature that is present in papilledema and other causes of optic disc swelling.
Optic neuritis and multiple sclerosis. Reductions in peripapillary retinal nerve fiber layer thickness have been reported in different multiple sclerosis-related subtypes from clinically isolated syndromes to secondary progressive multiple sclerosis. Several studies have also confirmed atrophy of the ganglion cell-inner plexiform layer in multiple sclerosis.
The 2024 revision of the 2017 McDonald criteria discusses the inclusion of the optic nerve as a fifth anatomical location for dissemination in space. An interocular difference of 6μm in OCT nerve fiber layer thickness supports optic nerve involvement (12).
Acute optic neuritis is associated with optic nerve swelling in about one third of patients and can be detected with OCT. In the months following recovery from optic neuritis, disc swelling (if present) resolves, and ganglion cell layer thinning develops. This is not a new injury; rather, it reflects the time for the injured cells to atrophy (13). Peripapillary retinal nerve fiber layer thickness decreases by approximately 10 to 40 µm in 3 to 6 months after the acute episode, and stabilization is observed at 7 to 12 months (10; 02). This thinning is more pronounced after neuromyelitis optica–associated optic neuritis than after other types of optic neuritis.
Non-arteritic ischemic optic neuropathy. OCT can be used to monitor the disease course with the assessment of optic nerve head edema that defines this condition in the acute setting, and optic atrophy that develops later. However, non-arteritic anterior ischemic optic neuropathy remains a clinical diagnosis. Acute findings include increased peripapillary retinal thickness associated with optic disc edema. In some cases, OCT discloses subretinal fluid. The macular ganglion cell inner plexiform layer thinning pattern often matches the visual field defects months after the onset of NAION. Ganglion cell layer and internal plexiform layer thinning have been shown to be better than retinal nerve fiber layer thinning in indicating early axonal loss in NAION, both because they occur faster and because optic nerve swelling precludes detection of thinning of the retinal nerve fiber layer.
Papilledema and pseudopapilledema. OCT measurements can demonstrate optic nerve head elevation characteristic of papilledema due to elevated intracranial pressure. This can be used to quantify and monitor pre- and post-treatment responses. In cases that have ganglion cell injury, macular ganglion cell thickness measurements can detect this.
Differentiating papilledema from other forms of optic disc edema or from congenital optic disc elevation (often called “pseudopapilledema”) can be clinically challenging, particularly when the degree of edema is not severe. OCT can be used to detect optic disc drusen, one cause of pseudopapilledema, using enhanced depth imaging (EDI-OCT). One can see optic disc drusen as hyporeflective structures with a hyper-reflective margin and no shadowing.
Compressive optic neuropathies. Compression of the optic nerve or chiasm usually leads to optic atrophy over time, which, due to retrograde degeneration, can be visualized on OCT. Subtle optic nerve damage from compressive optic neuropathy can be appreciated on OCT before it can be seen on ophthalmoscopy. This feature is especially true for the macular ganglion cell layer analysis because macular ganglion cell thinning precedes peripapillary retinal nerve fiber layer loss. Ganglion cell thinning can be observed even before appreciable changes are detectable on visual field testing.
OCT measures can indicate visual prognosis following treatment for compressive optic neuropathy, with minimal retinal nerve fiber layer loss indicating a better prognosis for recovery of a visual deficit (11; 09; 03; 07).
The pattern of macular ganglion cell loss helps localize compressive optic neuropathies involving the chiasm or optic tract because the pattern matches the characteristic pattern of visual field loss. In chiasmal injury, binasal macular thinning occurs because the crossing nasal fibers are damaged with chiasm compression. Homonymous hemi-macular ganglion cell loss suggests injury to the optic tract or lateral geniculate nucleus from various etiologies (eg, tumor, stroke, or demyelination) (05).
OCT may require pupillary dilation in some patients with very small pupils, which carries a small risk. Patients with poor mobility or orthopedic restraints may experience difficulty with head positioning or fatigue, but overall, this is a well-tolerated procedure.
Several factors can affect image quality, including pupil size; ocular media opacity, such as cataract or corneal dryness; and the ability of the patient to fixate. The automatic segmentation algorithms that generate quantitative measurements are more likely to have errors when image quality is poor. Structural distortions of the eye due to axial length or ophthalmic pathology can also lead to algorithmic errors. To evaluate for these effects, the interpreting provider should review the cross-sectional images on the report, including the segmentation lines. Classification of quantitative measurements should be interpreted in the context of the normative group used, which is often comprised of Caucasian subjects grouped by age, with normative data typically not available for children.
|
Test |
Principle |
Useful In |
|
Optic coherence tomography |
Uses time-delayed information contained in the light waves reflected from different depths |
• Optic neuritis |
|
B- and A-scan ultrasonography |
Grayscale image variations generated by changes in the tissue medium that reflect sound |
• Thyroid eye disease |
|
Fluorescein angiography |
Images created with light stimulation, with peak excitation wavelength of 465 to 490 nm and peak emission of 520 to 530 nm |
• Nonarteritic ischemic optic neuropathy |
|
Autofluorescence |
To produce autofluorescence, fluorophore absorbs a photon of the excitation wavelength, which elevates an electron to an excited, high-energy state and then dissipates some energy through molecular collisions and emits a quantum of light at a lower energy and longer wavelength. |
• Pseudopapilledema |
|
• Ophthalmic ultrasound is a noninvasive bedside diagnostic technique widely available in ophthalmology practices. | |
|
• With the proper training, ophthalmic ultrasound can extend the physical examination to evaluate for optic disc elevation or extraocular muscle swelling. |
Ophthalmic ultrasound provides quick, noninvasive, and cost-effective evaluations of the eye and the orbit. Use of ultrasound for evaluation of the nerve has been supplanted by OCT. Ultrasound is generally useful for bedside or clinical examinations of the orbit. It provides diagnostic information in various ophthalmic conditions, such as thyroid eye disease and scleritis, as well as retinal detachment or presence and type of an ocular malignancy or foreign body.
Ophthalmic ultrasound uses reflected sound waves to produce an image from tissue. The probe records relative density and reflectivity of the tissue and generates either a plot of depth (A scan) or intensity (B scan). A-scan can be used to measure the ocular axial length, among other things, but ultimately is beyond the scope of this article.
Optic disc drusen. B-scan ultrasound can be evaluated for optic disc drusen, which are visible as punctate hyper-reflective regions in the optic nerve head. However, it is not likely to be as sensitive as enhanced depth imaging OCT. The results are dependent on operator skill (06).
Optic nerve sheath. There is literature regarding optic nerve sheath measurements and their relationship to intracranial pressure in the acute or trauma setting. This is not widely used (01; 04; 15; 08).
Thyroid eye disease. Ultrasound can measure extraocular muscle reflectivity and thickness. Color Doppler can assess blood flow before and after thyroid ophthalmopathy treatment to measure response.
Ocular ultrasonography is contraindicated in suspected globe rupture for obvious reasons.
Ultrasonography is operator-dependent and subject to user training and experience. An MRI of the orbit with fat-suppression is preferred for its superior resolution and reproducibility for evaluating disorders of the orbit and adjacent structures.
|
• Fluorescein angiography displays the vasculature of the retina, choroid, and optic nerve head. | |
|
• This imaging helps distinguish between macular disease and optic nerve vision loss. |
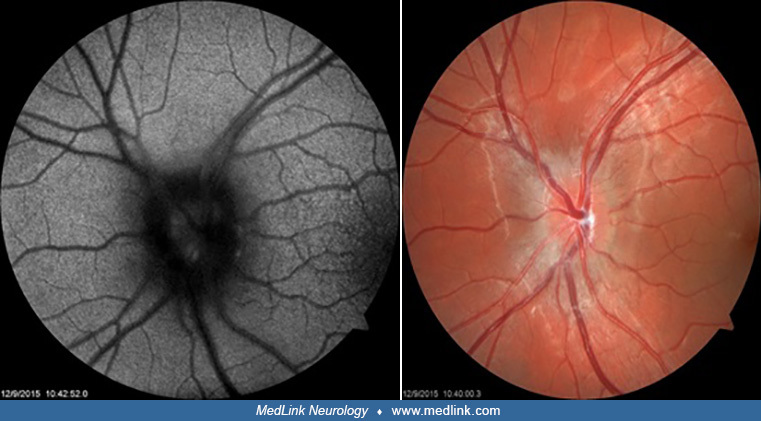
Fluorescein angiography is used to examine blood flow in the retina and detect breakdown in vascular integrity supplying the retina, choroid, and optic nerve. A skilled ophthalmic photographer is needed to capture the images.
The patient is given intravenous fluorescein, and retinal photography is performed to examine vascular filling patterns and defects in the retinal, choroidal, and optic nerve head veins and arteries.
Approximately 10 seconds after injection of contrast, the dye enters the short posterior ciliary arteries and appears in the optic nerve and choroid. Ten to 15 seconds after injection, the retinal circulation appears. Photos are taken every 1 to 2 seconds in the earlier phase. Peak fluorescence takes place at around 30 seconds, with recirculation following. Around 10 minutes after injection, the fluorescein is no longer visualized in the retinal vessels; however, the sclera, Bruch’s membrane, and optic nerve will continue to fluoresce. Contrast is excreted in the urine in the next 24 to 36 hours.
In healthy tissue, the blood-retina barrier prevents fluorescein from diffusing into retinal tissue, and the images show the dye as it passes from arterial to venous structures. Leakage of dye outside the vessels can show in areas with new vessel growth or in regions with blood-ocular barrier defects induced by inflammation or ischemia. There are some neuro-ophthalmic conditions for which fluorescein angiography can help make a diagnosis.
Fluorescein angiography is commonly utilized to evaluate perfusion abnormalities resulting from retinal vascular occlusions and to detect vessel leakage, for example, due to neovascularization, vasculitis, or optic disc edema. From a neurologic standpoint, it is most useful in evaluating retinal artery occlusions or vasculitides like giant cell arteritis and Susac syndrome.
Retinal vascular occlusions. Occlusions are visible as retinal filling delay or asymmetry in retinal vascular filling. These features can help confirm branch and central retinal artery occlusions as a cause of vision loss or detect asymptomatic events, for example, as in Susac syndrome.
Optic nerve head edema. Leakage on the optic nerve surface and staining occur in cases of pathological optic nerve head edema, which can help to distinguish it from pseudopapillema.
Giant cell arteritis. Affected patients can have patchy or delayed choroidal filling indicative of choroidal vascular supply involvement.
The procedure requires dilation of the pupils and intravenous administration of fluorescein dye. Although generally well tolerated, there can be nausea, vomiting, and vasovagal responses. The procedure is relatively contraindicated in pregnancy. Urine will be bright yellow after the procedure.
Interpretation of images is subjective rather than quantitative. It requires a trained photographer and specialized equipment, including invasive intravenous access. It is otherwise somewhat time-consuming and those with media opacities might not produce quality images.
|
• Fundus autofluorescence displays changes in the retinal pigment epithelium and the retina. | |
|
• This imaging modality is especially useful for capturing optic disc drusen, multiple evanescent white dot syndrome, and acute idiopathic blind spot enlargement. |
This technique has limited utility in a general neurology setting. It is primarily useful in a neuro-ophthalmologic setting for observing optic disc drusen or retinal pigment epithelium defects. Fundus autofluorescence is an imaging technique used to visualize changes or injury to the retina and retinal pigment epithelium that would otherwise not be well visualized on retinoscopy. Fundus autofluorescence is not invasive and does not require dye or contrast.
Fundus autofluorescence detects fluorophores in the outer segment of the photoreceptors, at the level of the retinal pigment epithelium. This technique provides insight into the metabolic status of the retinal pigmentary epithelium by revealing the distribution and accumulation of lipofuscin. Different ocular structures display degrees of autofluorescence and can be termed as being hyperautofluorescent if there is a brighter appearance or higher intensities than the background level (the homogenous level of autofluorescence generated in the posterior pole fundus of a healthy eye) and hypofluorescent if there is a darker appearance or lower intensities than the background level.
Fundus autofluorescence is used to evaluate patients with suspected optic nerve head drusen, maculopathies, or outer retinopathies.
In a normal eye, the optic nerve head is hypo-autofluorescent, as there is no retinal pigmentary epithelium layer. Retinal pathologies can cause dysfunction of retinal pigment epithelium and lipofuscin accumulation; this results in abnormal autofluorescence patterns.
Optic disc drusen. Optic disc drusen are typically hyperautofluorescent and visualized when they are near the surface of the optic disc. This is useful as an adjunct to enhanced-depth imaging OCT.
Acute idiopathic blind spot enlargement. Patients typically complain of positive visual phenomena and an enlarged blind spot. A fundus examination can demonstrate mild disc elevation. Fundus autofluorescence can show peripapillary fundus hyperfluorescence.
Multiple evanescent white dot syndrome. This presents with acute painless unilateral vision loss with scotomas. These patients also show multiple white lesions that appear as hypofluorescent at the level of the retinal pigment epithelium. On color photos of the retina, these appear as hypopigmented lesions thought to be due to disruption of the outer retina.
Like OCT, this imaging may require pupillary dilation in some patients with very small pupils, and this carries a small risk. Although generally well tolerated, those with mobility or physical impairments may experience fatigue or soreness based on positioning.
Interpretation is qualitative rather than objective. Some patients might require dilation before photography. This imaging is susceptible to artifact, including media opacities in the vitreous or anterior segment. In patients with these types of pathology, this imaging might be of limited utility. Imaging might be limited in patients with mobility or physical impairment, depending on positioning.
All contributors' financial relationships have been reviewed and mitigated to ensure that this and every other article is free from commercial bias.

Randall J Brown MD MSc
Dr. Brown of Legacy Medical Group and Standford University School of Medicine has no relevant financial relationships to disclose.
See Profile
Jonathan D Trobe MD
Dr. Trobe of the University of Michigan has no relevant financial relationships to disclose.
See ProfileNearly 3,000 illustrations, including video clips of neurologic disorders.
Every article is reviewed by our esteemed Editorial Board for accuracy and currency.
Full spectrum of neurology in 1,200 comprehensive articles.
Listen to MedLink on the go with Audio versions of each article.
MedLink, LLC
3525 Del Mar Heights Rd, Ste 304
San Diego, CA 92130-2122
Toll Free (U.S. + Canada): 800-452-2400
US Number: +1-619-640-4660
Support: service@medlink.com
Editor: editor@medlink.com
ISSN: 2831-9125
Neuro-Oncology
May. 27, 2026
General Child Neurology
May. 12, 2026
Neuro-Ophthalmology & Neuro-Otology
Apr. 07, 2026
Neuro-Ophthalmology & Neuro-Otology
Mar. 30, 2026
Neuro-Ophthalmology & Neuro-Otology
Mar. 30, 2026
Neuromuscular Disorders
Mar. 02, 2026
Neuro-Ophthalmology & Neuro-Otology
Mar. 02, 2026
Neuro-Ophthalmology & Neuro-Otology
Mar. 02, 2026