Neuropharmacology & Neurotherapeutics
Onasemnogene abeparvovec
May. 18, 2021
MedLink®, LLC
3525 Del Mar Heights Rd, Ste 304
San Diego, CA 92130-2122
Toll Free (U.S. + Canada): 800-452-2400
US Number: +1-619-640-4660
Support: service@medlink.com
Editor: editor@medlink.com
ISSN: 2831-9125
Toll Free (U.S. + Canada): 800-452-2400
US Number: +1-619-640-4660
Support: service@medlink.com
Editor: editor@medlink.com
ISSN: 2831-9125
Nearly 3,000 illustrations, including video clips of neurologic disorders.
Every article is reviewed by our esteemed Editorial Board for accuracy and currency.
Full spectrum of neurology in 1,200 comprehensive articles.
Listen to MedLink on the go with Audio versions of each article.
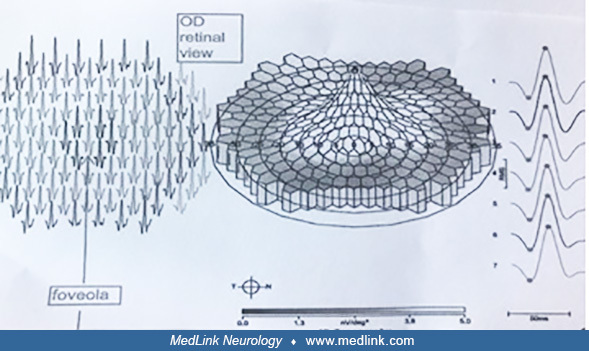
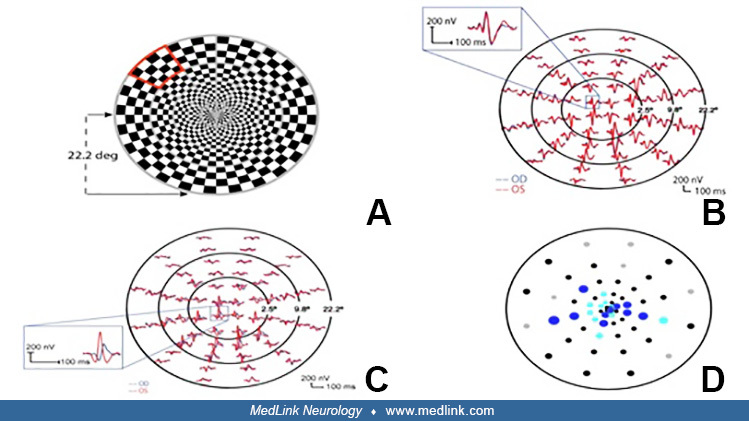
(A) Multifocal visual evoked potential stimulus contains 60 sectors of black and white checks (one sector shown in red). (B) Multifocal visual evoked potential responses from the right eye (blue) and the left eye (red) of a normal subject are very similar. (C) The multifocal visual evoked potential responses from the right eye with a history of optic neuritis are delayed in some sectors compared to those from the left eye (red). (D) An interocular latency probability plot marks the locations with significantly delayed latencies in the right eye with an optic neuritis history (dark blue for p < 0.01, light blue for p < 0.05) compared to the left eye. Black symbols denote no significant differences compared to a normative database; small gray symbols denote responses too small for comparisons. (Contributed by Dr. Han Cheng.)