Sleep Disorders
Neuroimaging of sleep disorders
Nov. 19, 2023
MedLink®, LLC
3525 Del Mar Heights Rd, Ste 304
San Diego, CA 92130-2122
Toll Free (U.S. + Canada): 800-452-2400
US Number: +1-619-640-4660
Support: service@medlink.com
Editor: editor@medlink.com
ISSN: 2831-9125
Toll Free (U.S. + Canada): 800-452-2400
US Number: +1-619-640-4660
Support: service@medlink.com
Editor: editor@medlink.com
ISSN: 2831-9125
Nearly 3,000 illustrations, including video clips of neurologic disorders.
Every article is reviewed by our esteemed Editorial Board for accuracy and currency.
Full spectrum of neurology in 1,200 comprehensive articles.
Listen to MedLink on the go with Audio versions of each article.
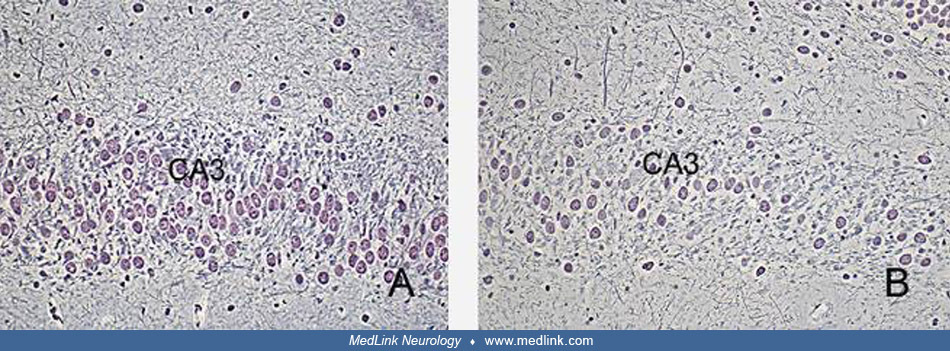
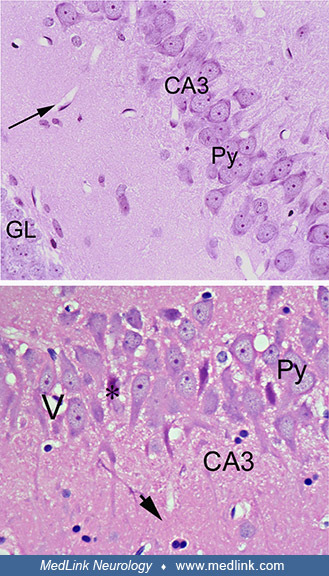
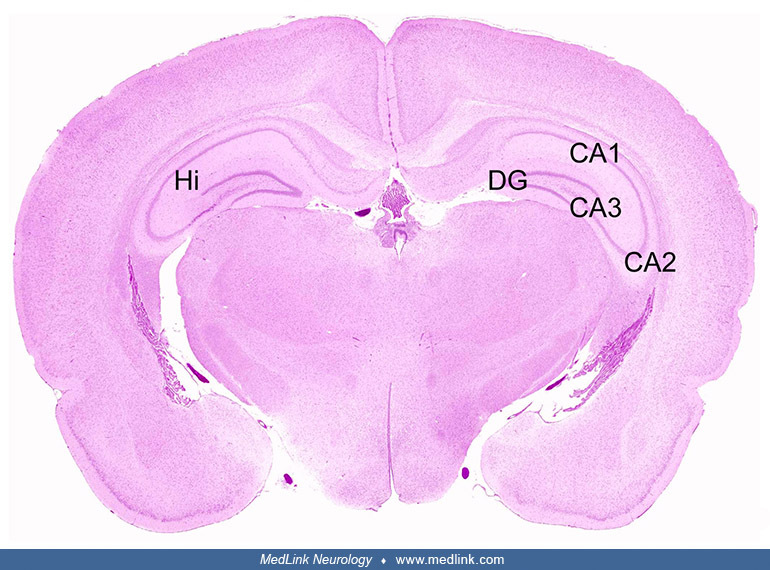
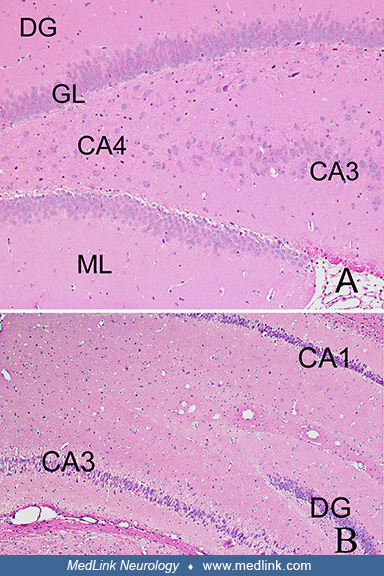
Top image (control rat) is a cross-section of the hippocampus of a control rat, showing the granular cell layer (GL) of the dentate gyrus (DG), the molecular layer (ML), and the CA3 and the CA4 regions. Objective x10. Bottom image (domoic acid-treated rat) is a section of the hippocampus of a rat treated with domoic acid, showing cell drop out and neuronal necrosis, particularly within the CA3 regions. Objective x5. Both images are from paraffin sections stained with hematoxylin and eosin. (Source: Pulido 2008. Creative Commons Attribution license. http://creativecommons.org/licenses/by/3.0. Images have been cropped and placed side by side for comparison by Douglas Lanska MD MS MSPH.)