Neuro-Oncology
Opsoclonus-myoclonus
Dec. 27, 2023
MedLink®, LLC
3525 Del Mar Heights Rd, Ste 304
San Diego, CA 92130-2122
Toll Free (U.S. + Canada): 800-452-2400
US Number: +1-619-640-4660
Support: service@medlink.com
Editor: editor@medlink.com
ISSN: 2831-9125
Toll Free (U.S. + Canada): 800-452-2400
US Number: +1-619-640-4660
Support: service@medlink.com
Editor: editor@medlink.com
ISSN: 2831-9125
Nearly 3,000 illustrations, including video clips of neurologic disorders.
Every article is reviewed by our esteemed Editorial Board for accuracy and currency.
Full spectrum of neurology in 1,200 comprehensive articles.
Listen to MedLink on the go with Audio versions of each article.
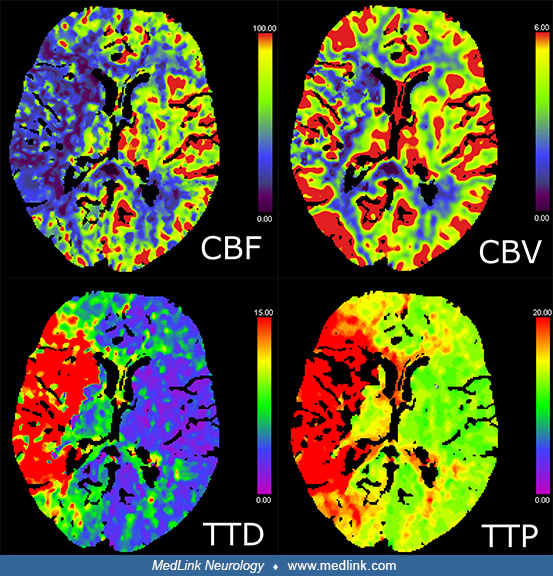
Color-coded transverse perfusion maps from computed tomography perfusion of cerebral blood flow (CBF), time to drain (TTD), and time to peak (TTP) show a large territorial perfusion delay in the right middle cerebral artery territory. A color-coded map of cerebral blood volume shows reductions of cerebral blood volume in a much smaller area containing the head of the right caudate nucleus and lentiform nucleus. (Contributed by Kristine Ann Blackham MD.)